Health Graph
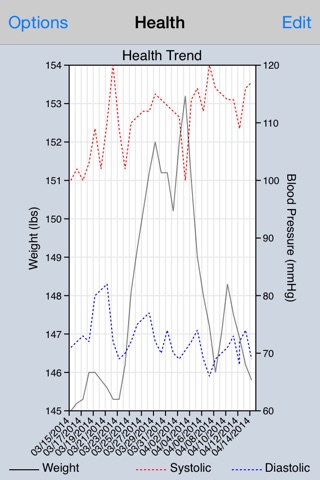
Health Graph shows your weight and blood pressure on a trend graph. Touch the Edit button to enter weight and blood pressure values, perhaps once a day or at your leisure. With that recording over time you can make informed decisions based on documented results. The data entry and viewing is intended to be so effortless that a long term trend is easy to accomplish.
Systolic and diastolic blood pressure or weight can be entered together or at separate times. For example, you may wish to enter blood pressure a few times per day and weight only once per day, skip a few days or enter the values as you are able or as needed.
The advanced algorithms do the rest and show you results in top-notch fashion. The trend graph autoscales to the full amount of data, from days or years worth. The left y-axis is for weight and the right y-axis is for blood pressure. That way recorded values line up in time in an efficient use of the screen. There are no complicated statistics because the curve variation is all telling. Touch-drag to the right to scan one curve at a time or double-touch to magnify and then touch-drag to scroll the graph and double-touch to demagnify. Touch-hold the trend graph to send it to others.
If you need more features (which results in additional complexity) then try the Expert setting. The Expert setting may be appropriate for clinical settings where multiple people are involved or you may want to use the Expert settings just because it is there or because you wish to copy the numeric data. Either way, Easy or Expert, there are options to help you make informed decisions.
When you have suggestions for improvements then please email [email protected] to let us know.


